Fraud Detection Using Benford law
- Isaac Omosa
- Feb 13, 2023
- 4 min read

Benford law Analysis using Excel to detect Fraud

Benford’s law is a mathematical tool and a method of determining whether investigated financial statements contain unintentional errors or fraud. Benford’s law says that counterfeit numbers have a slightly different pattern than valid or random samples. Benford’s Law is an effective method and analytical technique to help detect accounting fraud. Benford’s law is just one of the possible tools used to detect irregularities, which can also be used in the field of data verification in financial statements.
Fraud occurs due to intentionally manipulated data. In most cases, the amount of information is so large that 100% analysis and review by auditors or fraud examiners is impossible. But through the use of analysis tools i.e. Excel, and Benford law the data in question can be analysed to identify abnormally or hidden patterns that may be difficult to our naked eyes. Below is an example of using Benford law Using excel to examine any trends or exceptions in transactions.
When to use Benford Law
The assumptions regarding the data to be examined by Benford’s Law are that data must be numeric, random, not restricted by maximums or minimums or not assigned numbers and large sets of data.
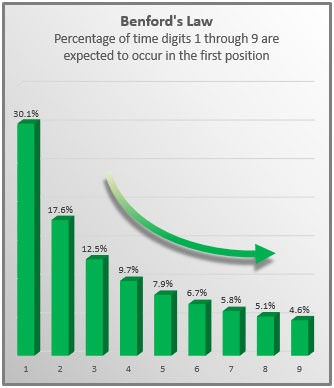
Benford's law of anomalous numbers states that generally, in naturally occurring collections of numbers, the leading digit is likely to be small. This means that the numeral 1 will be the leading digit in a genuine dataset 30.1 per cent of the time; the numeral 2 will be the leading digit 17.6 per cent of the time; and each subsequent numeral, 3 through 9, will be the leading digit with decreasing frequency. The resulting downward-sloping curve can be used as a baseline for determining whether a dataset is genuine or fabricated see below the occurrence frequency table.
Step 1: Extract the data
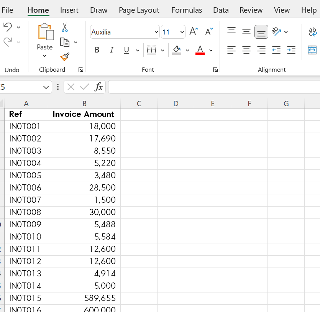
Extract or import the data set required to excel, the data can also be copy-pasted etc. The figure below shows an extract of the transaction listing (invoice ref, with corresponding amounts) for analysis. For analysis we will only be using the amount column (Colum B) all other columns will be ignored
Step 2: Extraction of the First Significant Digit
Since the analysis is based on the 1st Significant Digit i.e for invoice IN0T001 the amount of 18,000 has 1 as the First Digit.
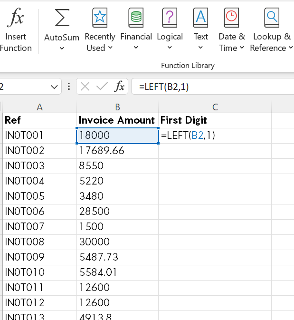
When using Excel the 1st Digit can be extracted using the LEFT Function whose Syntax is LEFT (text, [num_chars]), where text is the text string that contains the characters to be extracted, and Num_chars specifies the number of characters as required. Num_chars must be greater than or equal to zero. If num_chars is greater than the length of the text, LEFT returns all of the text and it is omitted, assumed to be 1. In this case, the left-most digit can be extracted by using the formula for C2 cell as =LEFT(B2,1) or simply by formula =LEFT(B2) and then replicate this formula over the remaining rows at the end of the transactions
Step 3: Create a Frequency of the First Significant Digit
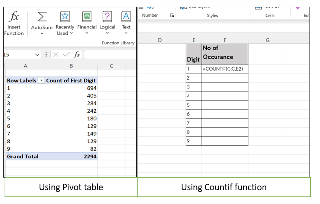
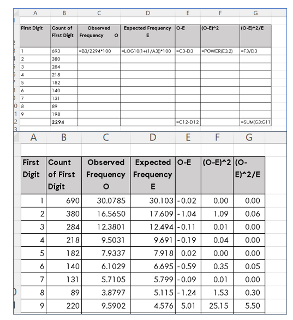
For the analysis to be conducted, once the leading or 1st Digits have been extracted, a summary frequency table showing count of occurrences for each digit 1-9 is required i.e Digit 1 under column C appears 694 times, this can be used using Pivot table or Countif formula.
Pivot table -Select column C and insert the pivot table – As shown in table
Using COUNTIF function = Insert formula =COUNTIF(C:C,E2) as show
Step 4: Comparison between observed and expected frequency
To be able to determine any abnormality when comparing the actual observations against expected values, the actual count of observations should be converted to a percentage (%) by dividing each digit frequency by the total number of observations.
To compare the digit frequency observed against the expected values, convert the observed frequency into a percentage. Select the data from the observed frequency and expected frequency percentage column and then graph the data.
Step 4: Graph the data
Plot the data set in the bar or line chart .

Analysis of the data
By analysing the invoice data in the example given above, Digit 9 occurs 8% of the time against expected occurrence which stands at 4%, this represents a huge difference between Observed and expected occurrence that required additional review i.e sample and review all transactions with payments First digit 9. There is a likelihood that the phenomena happened as most of the payments were made between 90,000 to 99,999 to avoid the higher approval authorities limit, i.e., approval for payments over 100,000, this is an indication of fraud. It may be a result of splitting invoices to avoid additional approvals, favouring a specific vendor and data manipulation.
In the fraudulent transactions scenario or manipulation of data, Benfors law data analysis can be applied to detect fraud with the application of auditing software or excel. This demonstrates that fraud detection can be one of the proactive activities to help auditors or detecting agencies identify abnormal transactions, and assist them in performing their tasks more effectively, efficiently and economically within a short span of time with help of simple Excel Functions, which will reduce the risk of fraud.


Comments